

Setting realistic expectations
Setting realistic expectations is something we are all guilty of failing to do! I recently read an article in the Telegraph which stated:
‘I’m 28 and a pretty terrible investor. I need your advice to turn £10,000 into £30,000.’
The timescale for this was five years, and the journalist was looking to invest £200 a month to achieve this return.
The question is whether this is realistic. Assuming they paid £2,400 a year, and growth was around 9% to 10% per annum, then it could be argued that this is a realistic target.
After reading the article, they argued that they had been disappointed in the last couple of years, which had delivered flat returns after seeing double-digit returns in previous years. It became clear that, like many investors since 2009, our expectations for returns have become skewed.
Turning to history
JP Morgan produces a guide to markets. This is a great place to start. The chart below shows the total equity and bond returns from US assets.

This tells us that over five years, US equity large cap has returned an average of between -7% p.a. and 30% p.a.
The chart below is from the same deck of slides. It is based on the FTSE and shows equity returns since 1900. The return is 4.9% p.a.

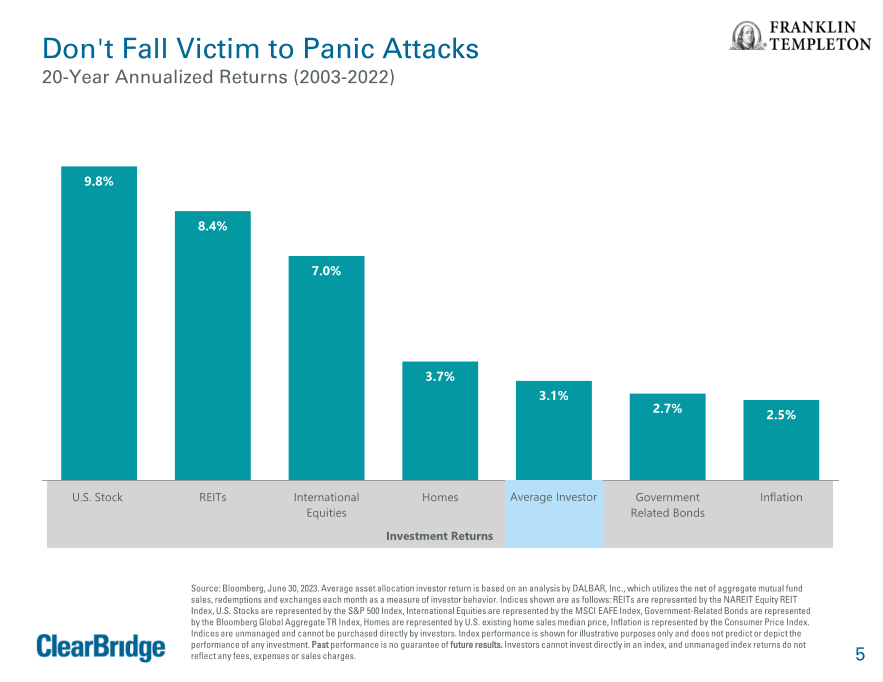
And one further chart from Franklin Templeton is helpful:
Understanding the market
We are all in danger of having unrealistic expectations. One of the most significant assumptions is to base our forecasts on what we have seen before. The danger with that is that it can lead to disappointment.
During the 90s, double-digit returns were expected. Then, the tech bubble burst, and returns were generally negative from around 2000 to 2003. Returns from 2003 to 2008 were not spectacular compared to the ’90s, and from 2009, being invested in the right place drove higher returns. Higher return expectations are understandable for those who only know the period from 2009.
We rarely discuss risk vs return. Dotcom, Bitcoin, AI, etc., are examples of spectacular returns followed by sudden falls.
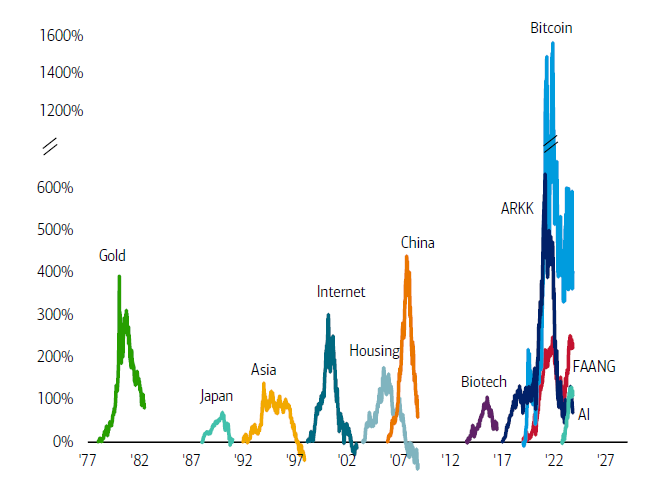
Source: BofA Global Investment Strategy, Bloomberg

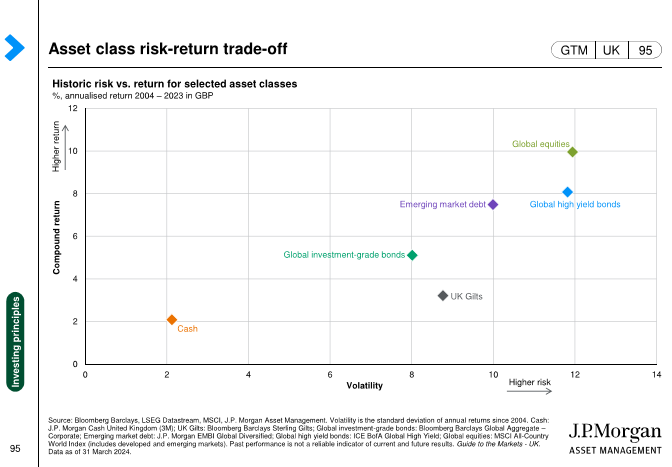
The main point is that driving the returns we want requires risk. The higher the return, the higher the risk.
We are in a difficult phase. We have seen almost two years of negative returns, significantly higher if we were invested in the wrong market areas. The chart below outlines the cycle of market emotions. My feeling has been that we reached the point of capitulation towards the end of last year.
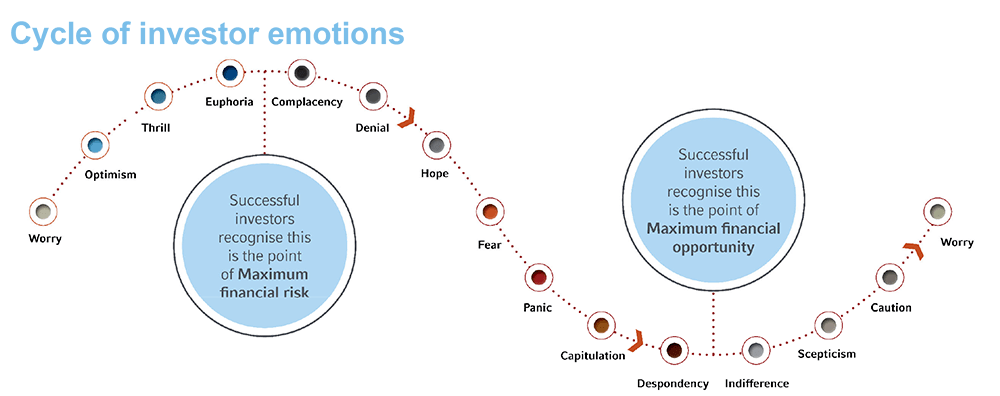
The question is, what now?
The crystal ball
Are the journalist’s expectations over the next five years wrong? The chart below shows the 10-year annualised return of markets.

This doesn’t tell us what the future holds. However, there are some indicators. The chart below shows that the US remains expensive compared to other parts of the market (which might reflect the so-called magnificent seven).

The chart below looks at the magnificent seven vs the rest of the US market.

If other markets are cheap compared to the US and if we are close to the bottom of a negative market cycle, the returns will be a mixture of short-term recovery and longer-term growth. Therefore, if this assumption is correct, a return of 9% per annum is not unrealistic. The chart below shows this over 10 to 15 years, reflecting the recovery and smoothing out of returns.

The point is that we must be realistic in our expectations. I would argue that a broad mix of investments should return 6% to 8% over ten years. However, I wouldn’t bet against a strong recovery in some regions of the market, which could deliver 10% plus returns over the next five years.
Investors face dangers from chasing returns and assuming they can predict the future. In a world where we crave certainty, the markets are where we will discover that there is no such thing as certainty.
Conclusion
The most important place to start is with the plan:

The journalist has a plan; they want £30,000 in five years. They have £10,000 and will invest a further £12,000 over five years. The question is whether a 9% p.a. return is achievable. Looking at all the data, it is possible, but markets are not predictable, and trying to guess the future returns could lead to disappointment. The diagram above is one of my favourites from Behavior Gap. Having a plan is where we start; to achieve that, we need to review it and be prepared to change. Setting realistic expectations at the start will ensure we won’t be disappointed.
If you would like to speak to Manning Gee Investments about your financial plans, please get in touch with us today.
General disclaimer: The data has been sourced from external sources. Although we have looked to ensure this is as accurate as possible, we are not responsible for the data they supply. This blog reflects the author’s view; it does not necessarily reflect the opinions of Manning Gee Investments Limited. Individuals wishing to buy any product or service because of this blog must seek advice or conduct their research before making any decision. The author will not be liable for decisions made because of this blog (particularly where no advice has been sought). Investors should note that past performance does not guide future performance, and investments can fall and rise.