
Key Takeaways
- Market falls are normal and can happen for various reasons; they may not always lead to permanent losses.
- Investors should avoid panic selling during falls, as it can lock in losses and complicate future decisions.
- A financial plan helps navigate market downturns by providing a framework for decisions based on individual goals and risk tolerance.
- Time and diversification can reduce risks but do not eliminate them; recovery timelines are unpredictable.
- Historical context shows that markets can recover, but individual investments may not; patience and discipline are crucial.
And what history can teach us
Long-term investment charts often finish in the top right-hand corner. They can make investing look like a smooth journey in which patience is always rewarded.
The destination matters, but so does the route. Markets rise and fall along the way, and the point at which someone invests can shape how that journey feels. A chart can be accurate and still hide the uncertainty, fear and difficult decisions experienced in real time.

Illustration 1: Long-term growth can hide a difficult journey
Source: TotalReturns.com. US dollar data; included for illustration only.
Building on the last guide
In the previous guide, we explored what investment risk actually means. The main messages were:
- Investment risk is personal. It depends on your goals, timeframe and capacity to absorb a loss.
- Volatility is not the same as permanent loss, although both matter.
- Risk includes more than falling markets. Inflation, shortfall, timing and behaviour can all affect the outcome.
- A financial plan helps connect investment decisions to the life the money needs to support.
- Avoiding every risk is impossible. The aim is to understand and manage the risks that matter most.
This guide takes the next step. It looks at what happens when markets fall, why downturns are a normal part of investing and how a plan can help people avoid decisions they may later regret.
Market falls are normal – even when the cause is unusual
Market falls do not all look the same. Some happen suddenly; others unfold over months or years. The trigger may be a recession, a banking crisis, an oil shock, a war, a health emergency or simply a change in what investors are willing to pay.
The table below sets out several of the largest falls in the modern history of the US equity market. The figures are approximate and different data providers may use slightly different dates or index series. The purpose is not to compare one crisis precisely with another. It is to show that substantial falls have occurred for very different reasons.
| Event | Peak / period | Approx. peak-to-trough fall | Approx. time to trough | What was happening |
| Wall Street Crash and Great Depression | 1929-1932 | 86% | 34 months | Speculation and leverage gave way to bank failures and a severe economic contraction. |
| 1973-74 bear market | 1973-1974 | 48% | 21 months | The oil embargo, high inflation and recession created a prolonged fall. |
| Black Monday | 1987 | 34% | About 3 months | An abrupt global sell-off was amplified by programme trading and market structure. |
| Dot-com bust | 2000-2002 | 49% | 30 months | Very high technology valuations unwound as expectations met economic reality. |
| Global financial crisis | 2007-2009 | 57% | 17 months | The housing and banking crisis caused a deep loss of confidence and liquidity. |
| COVID-19 crash | 2020 | 34% | About 1 month | Lockdowns caused a sudden stop in economic activity and a rapid dash for cash. |
Source note: approximate S&P 500 and predecessor-index figures compiled from widely used market histories. Figures are rounded and exclude the effect of fees, tax and currency movements.
Short shocks can feel just as unsettling
Not every fall becomes a long bear market. Since 2000, investors have also experienced sharp shocks that lasted days, weeks or months. Some recovered quickly; others became part of a longer period of uncertainty.
| Event | Year | Approx. market move | Speed / duration | Immediate context |
| 9/11 attacks | 2001 | S&P 500 fell about 11.6% | Five trading days after reopening | A sudden geopolitical shock; US exchanges had been closed for four trading days. |
| US flash crash | 2010 | Major US indices fell roughly 9% intraday | Minutes, with much of the fall quickly reversed | A large sell order met fragile liquidity and fast automated trading. |
| Eurozone debt crisis | 2011 | S&P 500 fell about 19.4% | Around five months | Sovereign-debt fears and a US credit-rating downgrade damaged confidence. |
| China Black Monday | 2015 | Shanghai Composite fell 8.5% in one day | One trading day | Concern about China’s economy, currency and a domestic equity bubble. |
| Volatility shock | 2018 | S&P 500 entered a 10% correction | Roughly two weeks | Rising volatility caused losses in products designed to profit from calm markets. |
| COVID-19 liquidity shock | 2020 | Global equities fell sharply; S&P 500 fell 34% | About one month | The pandemic triggered a sudden global dash for cash. |
| Yen carry-trade unwind | 2024 | Nikkei 225 fell 12.4% in one day | One trading day | Changing Japanese interest-rate expectations contributed to rapid deleveraging. |
Important: these figures refer to different indices and measurement periods, so they are not directly comparable. The SEC/CFTC report provides further context on the 2010 flash crash; the Bank of England has documented the March 2020 dash for cash.
Why do markets fall?
Markets are forward-looking. Prices reflect what investors collectively expect about company profits, interest rates, inflation and the wider economy. When those expectations change, prices can change quickly.
Falls may begin with a clear event, but the scale of the move often depends on what came before it. High valuations, heavy borrowing, crowded trades or excessive optimism can make a market more vulnerable. That is why the phrase “this time is different” deserves caution. Every event is different, but the human pattern of optimism, fear and changing expectations is not new.

Illustration 2: Different bubbles, similar patterns of enthusiasm and reversal
Source: Royal London Asset Management. Past performance is not a reliable indicator of future results.
This does not mean every strong market is a bubble, or that a fall must be imminent. It means that confidence should not replace discipline. It is usually easier to identify a bubble afterwards than to call its peak in advance.
Do markets always recover?
Broad, diversified equity markets have historically recovered from major falls, but recovery has not followed a timetable. Some downturns lasted weeks; others took years. Individual companies, sectors and even national markets may not recover at all.
That distinction matters. History supports patience and diversification; it does not provide a guarantee. A plan should allow for the possibility that recovery takes longer than hoped.

Illustration 3: Bull and bear markets vary greatly in length and scale
Source: J.P. Morgan Asset Management, Guide to the Markets – UK. Data shown in the supplied chart.
A fall during the year does not decide the final result
A market can fall sharply and still finish the calendar year in positive territory. The chart below compares the deepest fall within each year with the return at year end. It is a useful reminder that the most worrying point of the year is not always the end of the story.

Illustration 4: Intra-year falls can occur even in positive calendar years
Source: J.P. Morgan Asset Management, Guide to the Markets – UK. Returns shown relate to the MSCI World Index in the supplied chart.
The chart should not encourage anyone to ignore risk. It simply shows why reacting to a fall without reference to the wider plan can be harmful. No one knows in the moment whether a decline will reverse quickly or deepen further.
Why panic selling can be damaging
Market falls are not only a test of the investments. They are also a test of behaviour.
People tend to feel the pain of a loss more strongly than the pleasure of an equivalent gain. When headlines become alarming, taking action can feel safer than doing nothing. Selling may provide immediate emotional relief, but it can also crystallise a fall and create a second difficult decision: when to invest again.
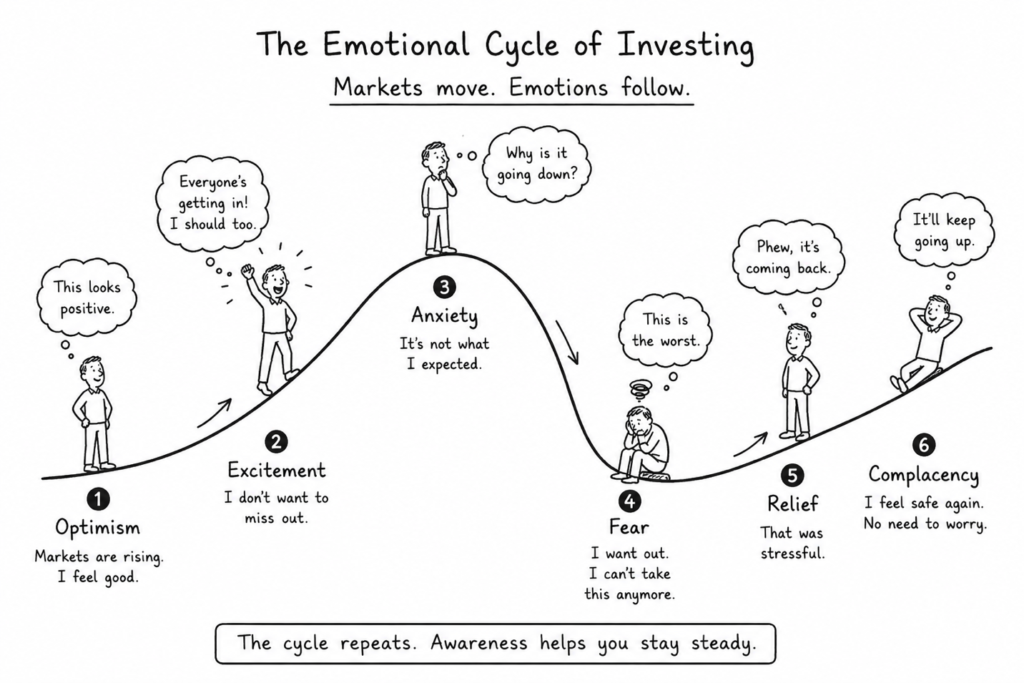
Illustration 5: The emotional cycle of investing
Illustration supplied for this paper. The cycle is simplified, but it captures how optimism, fear and relief can influence decisions.
Imagine selling after a 30% fall in early 2020. The sale would have locked in the decline. The investor would then have needed to decide when conditions felt safe enough to return – yet markets often recover before the news feels reassuring.
There is an important balance here. Staying invested is not automatically right in every situation. A portfolio may need to change if the investor’s goals, timeframe, spending needs or capacity for loss have changed. The key is to make that decision through the plan, not as a reaction to fear alone.
The other behavioural risk: chasing the story
Fear can push people out of markets. Excitement can pull them into whatever has recently risen the most. Stories about a successful share, fund or cryptocurrency are persuasive because the outcome feels vivid and possible.
However, those stories often become loudest after much of the rise has already happened. An asset can deliver exceptional gains and still expose a late investor to a severe fall. The table below uses two widely discussed examples. It is not a comparison of suitability and it does not suggest that the assets are equivalent.
| Year | Nvidia total return (USD) | Bitcoin price return (USD) | What the pattern illustrates |
| 2020 | +122.3% | +303.2% | Strong gains can attract attention after the move is already under way. |
| 2021 | +125.5% | +59.3% | Momentum and enthusiasm can continue for longer than expected. |
| 2022 | -50.3% | -64.3% | A change in interest rates and sentiment can produce severe losses. |
| 2023 | +239.0% | +155.4% | Recovery can be powerful and difficult to time in advance. |
| 2024 | +171.3% | +123.1% | Strong stories can become even more persuasive as prices rise. |
| 2025 | +38.9% | -7.1% | Assets linked in popular narratives can still produce very different outcomes. |
Sources: TotalReturns.com for Nvidia total returns and Slickcharts for Bitcoin calendar-year price returns. Figures are rounded, shown in US dollars and exclude an individual UK investor’s fees, tax and currency experience.
The lesson is not that successful investments should be avoided. It is that a compelling story is not a substitute for understanding the risks, the price being paid or the role an investment is expected to play in a diversified portfolio.
Time can help, but it does not remove risk
Longer holding periods have historically reduced the range of outcomes from diversified portfolios. The next chart uses US assets and shows that one-year returns varied widely, while the range narrowed over longer periods.

Illustration 6: Historical return ranges narrowed over longer holding periods
Source: J.P. Morgan Asset Management, Guide to the Markets – UK. US asset data in the supplied chart; past performance is not a reliable indicator of future results.
Time gives investments more opportunity to recover from setbacks and for company earnings to grow. It also gives investors more time to experience further shocks. That is why the investment timeframe should come from the goal. Money needed soon should not depend on a market recovery arriving at the right moment.
Markets often recover before uncertainty disappears
The chart below looks at returns after major economic and geopolitical shocks. The one-year result was sometimes negative, but the three-year result was positive in most of the examples shown. The precise outcome depended on the starting point, valuation and wider economic conditions.
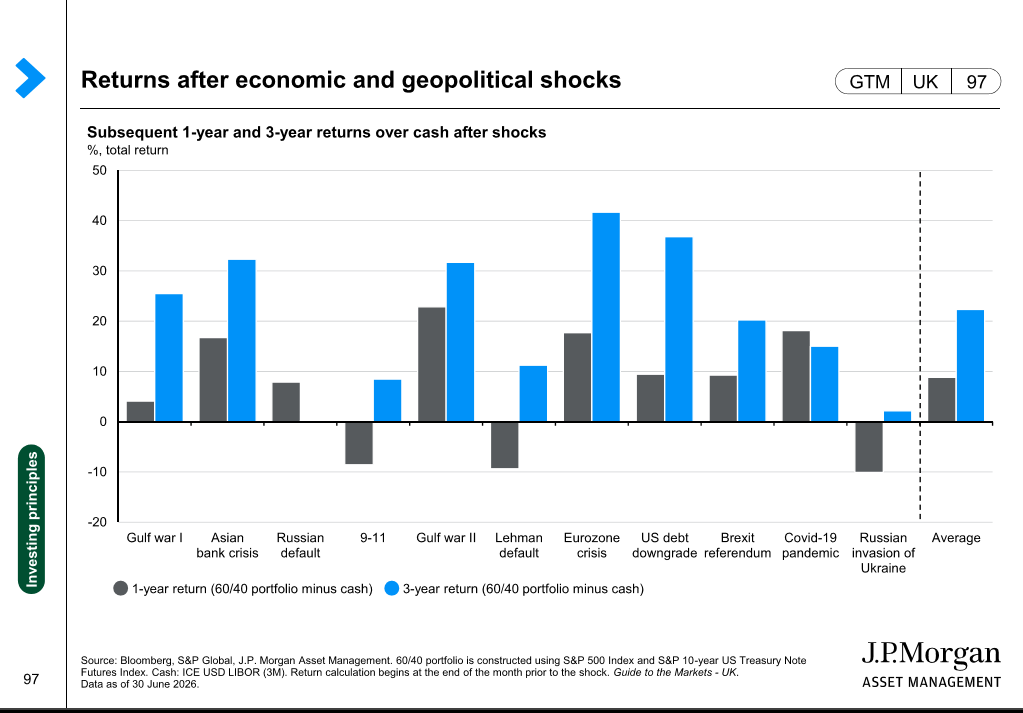
Illustration 7: Returns after major economic and geopolitical shocks
Source: J.P. Morgan Asset Management, Guide to the Markets – UK. The examples are historical and do not predict the outcome of a future shock.
The practical challenge is that recovery often begins while the outlook still feels uncomfortable. Waiting for certainty can mean waiting until prices have already risen.
The role of planning and discipline
A plan cannot prevent markets from falling. It can, however, provide a framework for deciding what to do when they do.
Good financial planning starts with the person rather than the investment. It asks what the money needs to achieve, when it may be needed and how much uncertainty the individual can reasonably accept. Those answers then shape the mix of cash, investments and other assets.
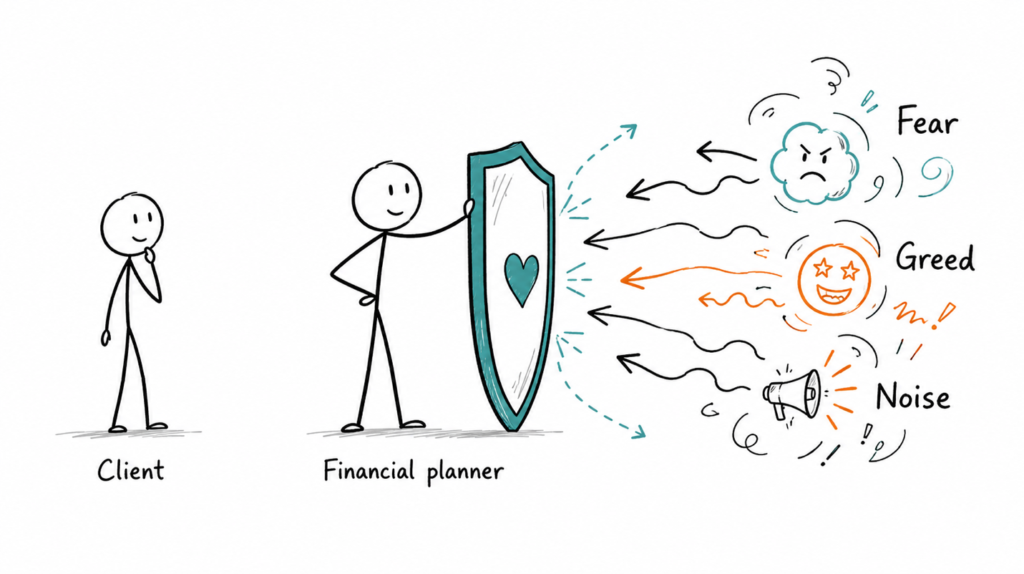
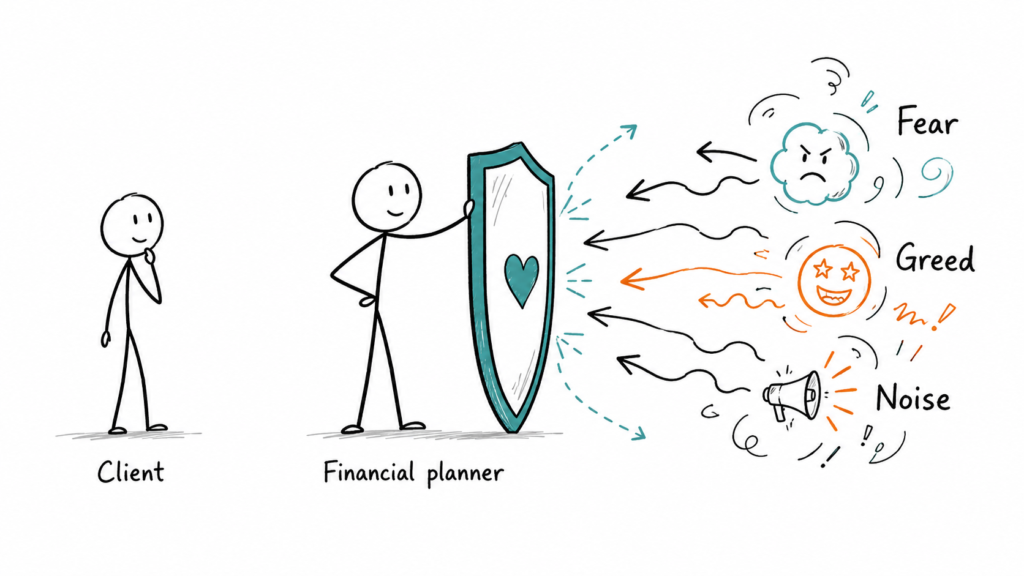
Illustration 8: A financial planner can help create distance between the plan and the noise
Original Manning Gee Investments / Money Wise UK illustration.
One valuable role of a financial planner is to create space between an investor and the noise surrounding them. That does not mean stopping every change. It means slowing the decision down and testing it against the plan.
The useful questions are rarely “What will the market do next?” or “Which investment will rise the most?” They are more likely to be:
- What is this money for?
- When might I need it?
- Do I have enough cash for short-term needs and unexpected costs?
- Would a market fall change my lifestyle or simply change a number on a statement?
- Is the portfolio diversified across different assets, regions and companies?
- Has my plan changed, or have only the headlines changed?
Many people approach a financial planner because they do not want money to dominate their lives. They want a plan that can support a sustainable retirement income, help them grow and protect wealth, and allow them to pass money on to the people who matter to them.
The plan creates discipline, but it is not static. It may need to adapt when life changes, when spending changes or when the original assumptions no longer remain reasonable. What it should avoid is reacting to every shock, prediction or fashionable investment.
Key messages
- Market falls are a normal part of investing, although every downturn has a different cause and duration.
- Broad markets have historically recovered, but recovery is not guaranteed and may take years. Individual investments may never recover.
- Selling during a fall can crystallise a loss and creates the difficult problem of deciding when to return.
- Chasing a popular story can be just as damaging as panic selling. Recent performance tells us what has happened, not what will happen next.
- Time and diversification can help manage risk, but they cannot remove it.
- A financial plan gives investment decisions a purpose and provides a framework for responding to uncertainty.
Next month: investing when the future is uncertain
History can help us put market falls into context, but it cannot tell us what will happen next. In the next guide, we will look at how to invest when the future feels uncertain. We will explore the difference between news and noise, the role of phasing investments, diversification across time and why accepting uncertainty can be more useful than trying to eliminate it.
Frequently Asked Questions (FAQs)
1. Why do investment markets fall?
Markets can fall when expectations about company profits, interest rates, inflation or the wider economy change. Falls may happen suddenly or develop gradually over several months.
2. Do markets always recover after a fall?
Broad, diversified markets have historically recovered from major falls, but recovery is not guaranteed and can take years. Individual companies, sectors or investments may never recover.
3. Should I sell my investments when markets fall?
A market fall alone is not normally a reason to abandon a long-term plan. Selling can crystallise a loss and creates another difficult decision about when to invest again.
4. How long does it take markets to recover?
There is no fixed timetable. Some market falls have reversed quickly, while others have taken several years to recover.
5. How can a financial plan help during a market downturn?
A financial plan connects your investments to your goals, timeframe and future spending needs. It provides a framework for making considered decisions rather than reacting to fear, headlines or short-term market movements.
Selected sources
- Manning Gee Investments – Financial Education Hub
- Manning Gee Investments – What Does “Investment Risk” Actually Mean?
- J.P. Morgan Asset Management – Guide to the Markets
- Royal London Asset Management – AI: It is and is not a bubble
- SEC and CFTC – Findings Regarding the Market Events of May 6, 2010
- Bank of England – Assessing the resilience of market-based finance
- TotalReturns.com – historical return charts
General disclaimer:
The information in this financial education guide is for general educational purposes only and should not be considered personal financial advice.
We source some data from external providers. While we aim to ensure the information is accurate and up to date, we cannot guarantee the accuracy or completeness of information provided by third parties.
This guide is based on UK tax rules and legislation as at March 2026, which may change in the future and may affect the information provided.
Anyone considering a financial product or service should seek professional advice or carry out their own research before making any decisions.
Investments can fall as well as rise and returns are not guaranteed. You may get back less than you originally invested.